In today’s complex labor market, U.S. businesses are grappling with a dual challenge: persistent worker shortages and rising costs that are squeezing profit margins across many industries. At the same time, a growing number of firms are reversing years of offshoring by bringing jobs back to the U.S.—a shift driven by the need for supply chain resiliency and geopolitical stability. But domestic labor, while potentially more stable, comes at a premium price, prompting employers to take a closer look at the full cost of maintaining a domestic workforce.
Against this backdrop, researchers at Construction Coverage—a brand that provides data-driven insights to help construction professionals make better business decisions— examined new data from the U.S. Bureau of Labor Statistics (BLS) to identify the true cost of employing workers in the private sector. This analysis goes beyond base wages to include a common suite of benefits—ranging from health insurance and retirement plans to legally mandated contributions like Social Security and workers’ compensation insurance.
The report explores how quickly compensation costs are rising and breaks down key components of these costs. It also highlights how compensation varies by business size, union status, industry, and location, offering insight into the wide ranges employers face when it comes to labor costs.
Here are some of the key takeaways from the report:
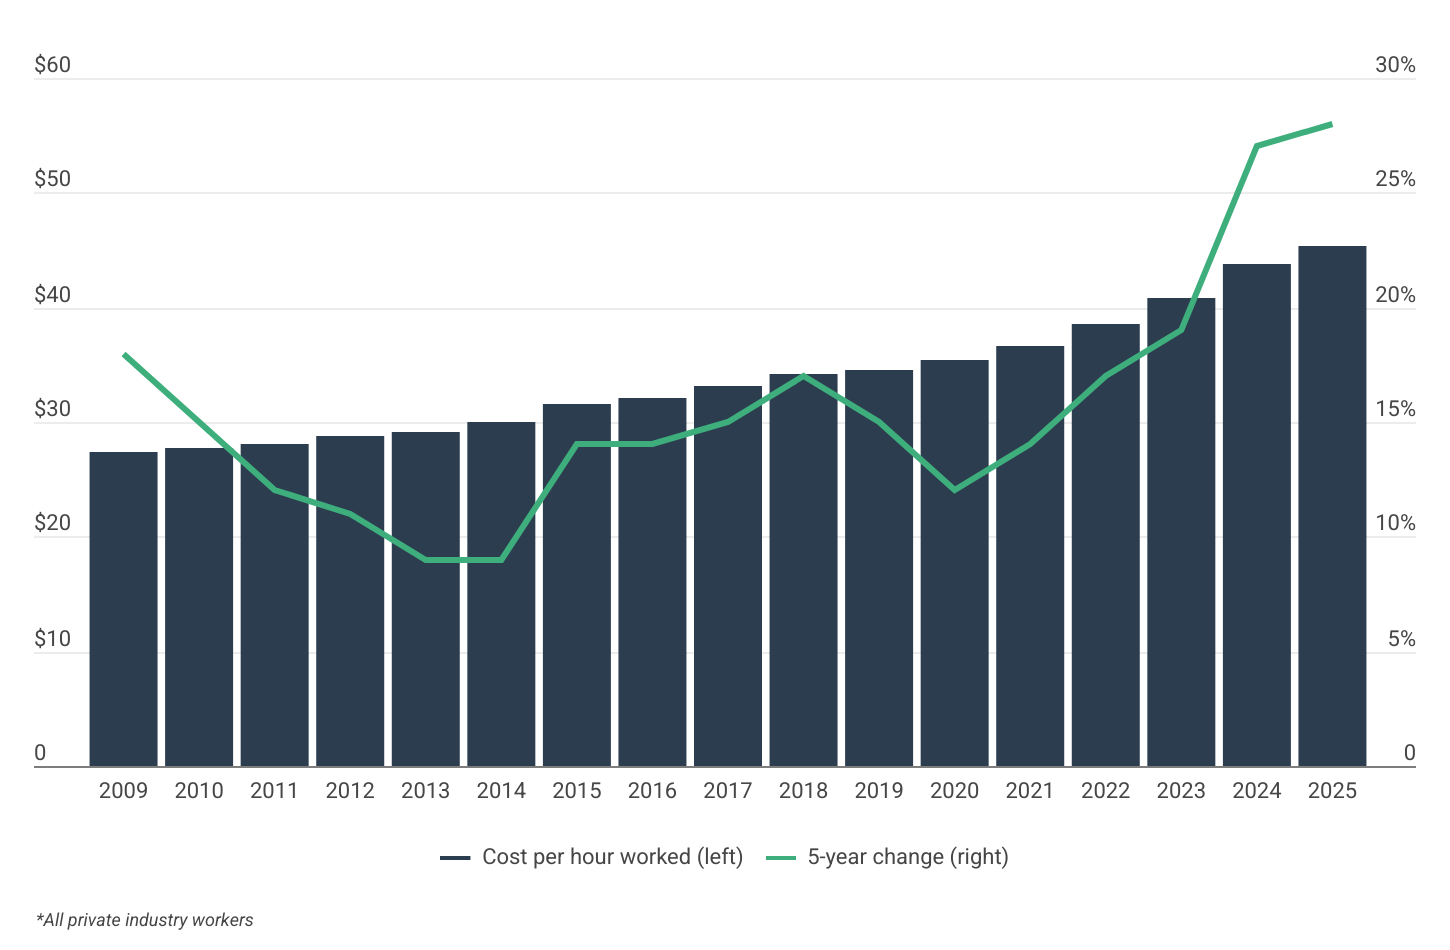
- Labor costs are rising quickly: Total compensation per hour worked reached $45.38 in March 2025, up 28% over the past five years—the fastest rate of growth in over 15 years.
- Benefits account for a significant share: On average, benefits account for 30% of compensation costs, resulting in a labor burden rate of 42.3% for private-sector employers.
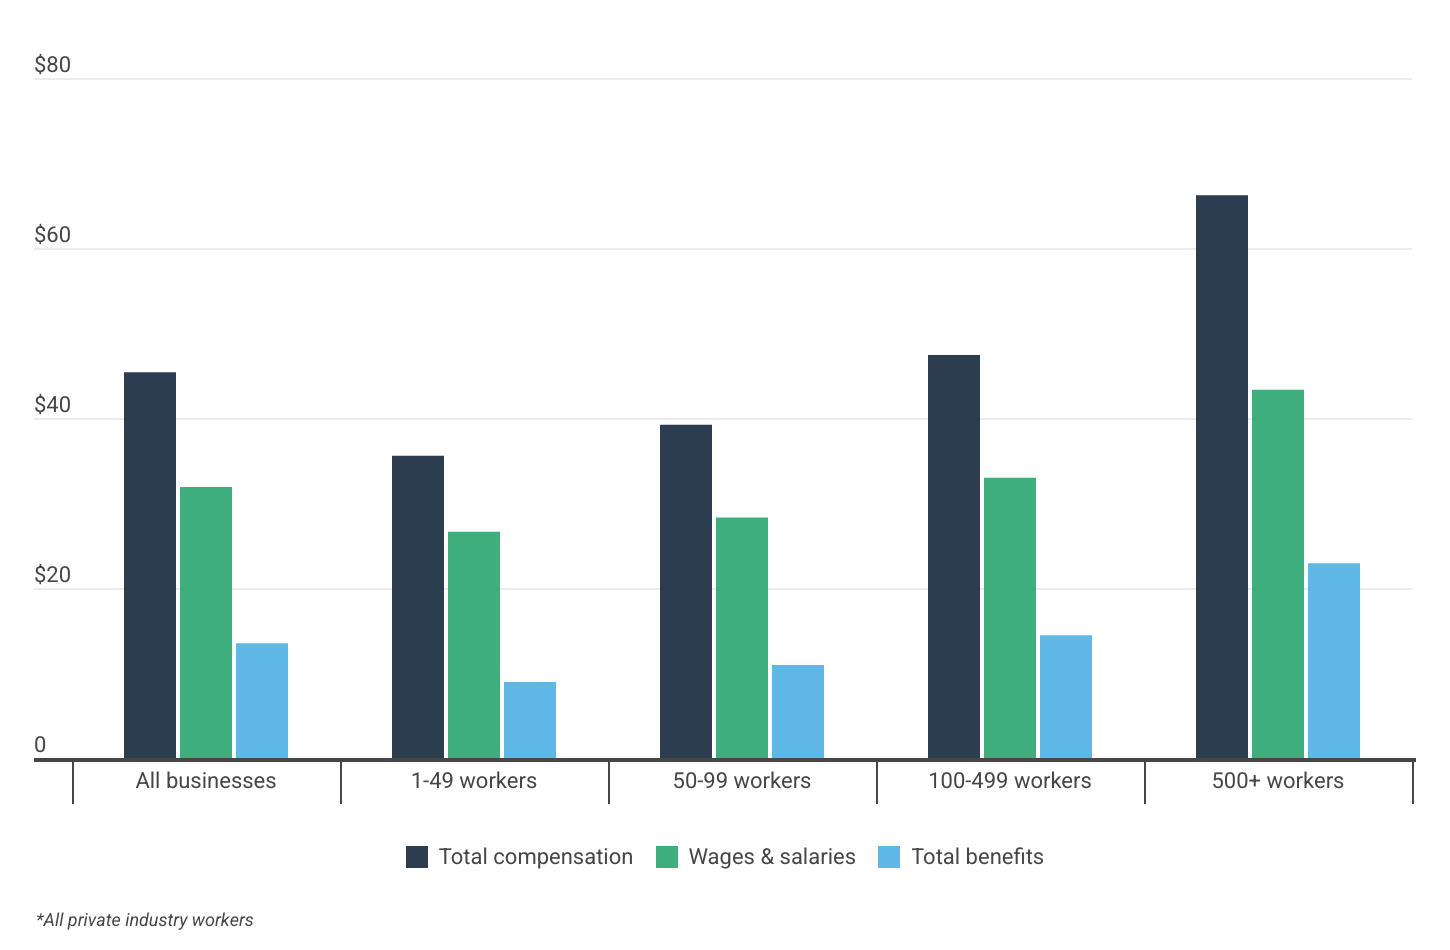
- Larger firms spend more on benefits: At firms with 500+ employees, the labor burden rate is 52.9%, compared to 33.6% at firms with fewer than 50 workers.
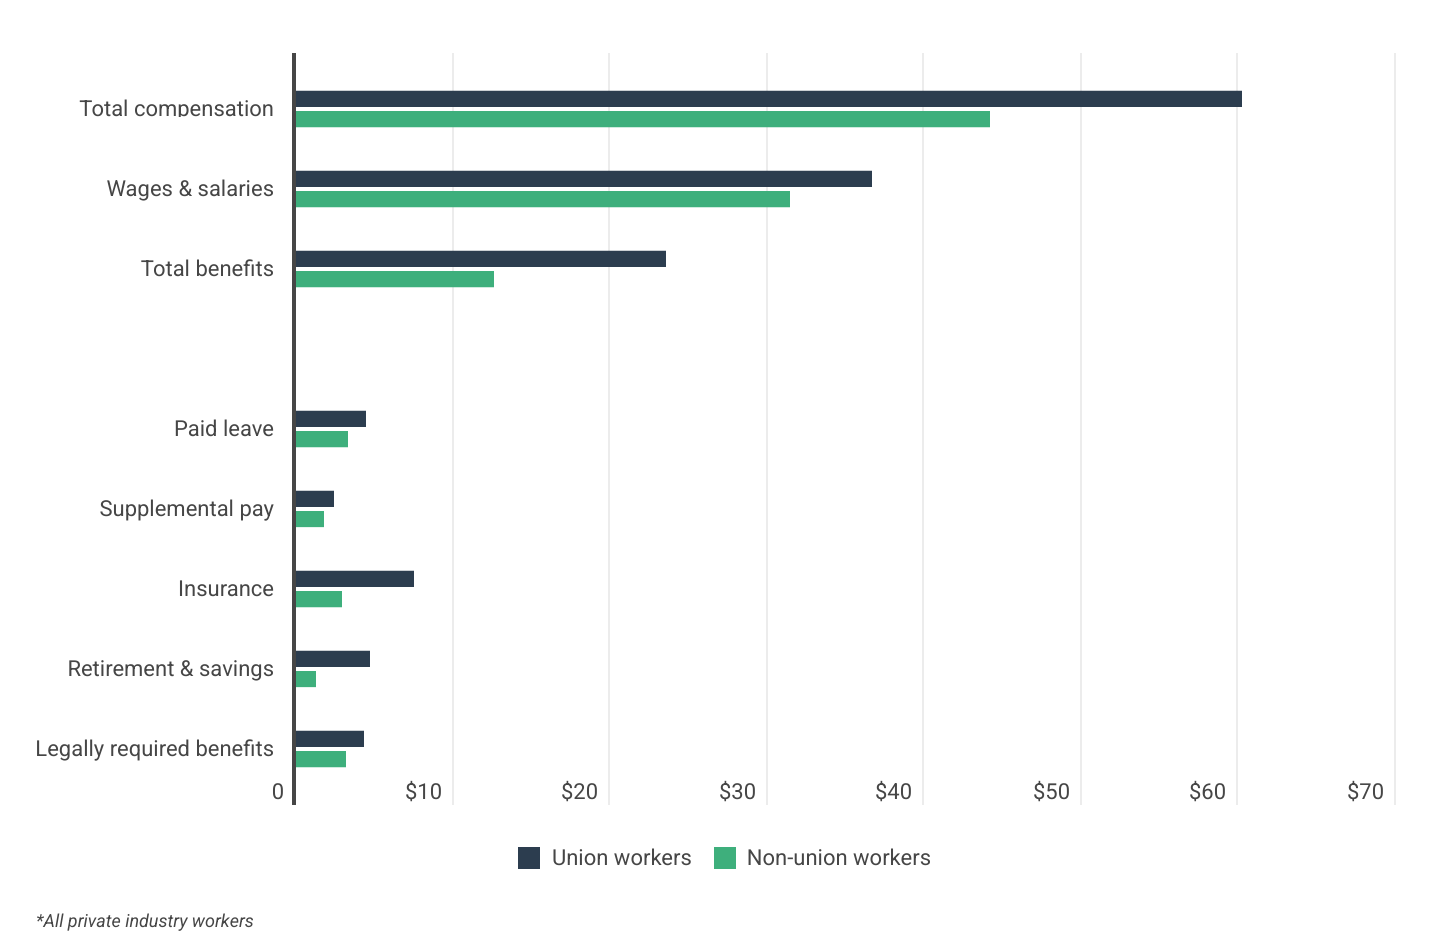
- Unionized workers cost more: Union employers face a higher labor burden rate (64.2%) and total compensation costs ($60.21 per hour) than non-union employers (40.1% and $44.13 per hour), driven largely by benefits. Benefits make up nearly 40% of union compensation, compared to 29% for non-union.
- Industry patterns reflect wage and benefit dynamics: High-wage industries such as utilities, information, and finance not only offer higher salaries but also provide disproportionately more in benefits, resulting in higher labor burden rates. In contrast, lower-wage sectors like retail and leisure and hospitality offer fewer benefits and have the lowest overall compensation levels.
- Geographic differences mirror economic structure: Among the metros evaluated, the Bay Area leads in total compensation costs ($71.63 per hour), while Miami and Phoenix rank lowest. Labor burden rates tend to be higher in metros with a greater union presence, such as Detroit and Boston.
How Fast Are Employee Compensation Costs Rising?
Source: Construction Coverage analysis of BLS data | Image Credit: Construction Coverage
Total labor costs—including wages and benefits—for private sector employers have accelerated sharply in recent years, reaching their fastest growth rate in at least the past 15 years. As of March 2025, the average cost of compensation per hour worked hit $45.38. For a full-time employee working 40 hours per week year-round, this equates to roughly $94,000 annually—highlighting just how substantial the burden of employee compensation has become.
For much of the past decade, compensation costs rose steadily but at a more moderate pace. From 2009 to 2019, five-year changes in labor costs hovered mostly in the low-to-mid teens, capping out at 17%. This changed dramatically beginning in 2020, when pandemic-era disruptions, labor shortages, and inflationary pressures began to reshape the economy. Since then, labor costs have surged, with five-year growth rates accelerating from 12% in 2020 to 19% in 2023 and 28% in 2025.
How Much Do Benefits Cost U.S. Employers?
Source: Construction Coverage analysis of BLS data | Image Credit: Construction Coverage
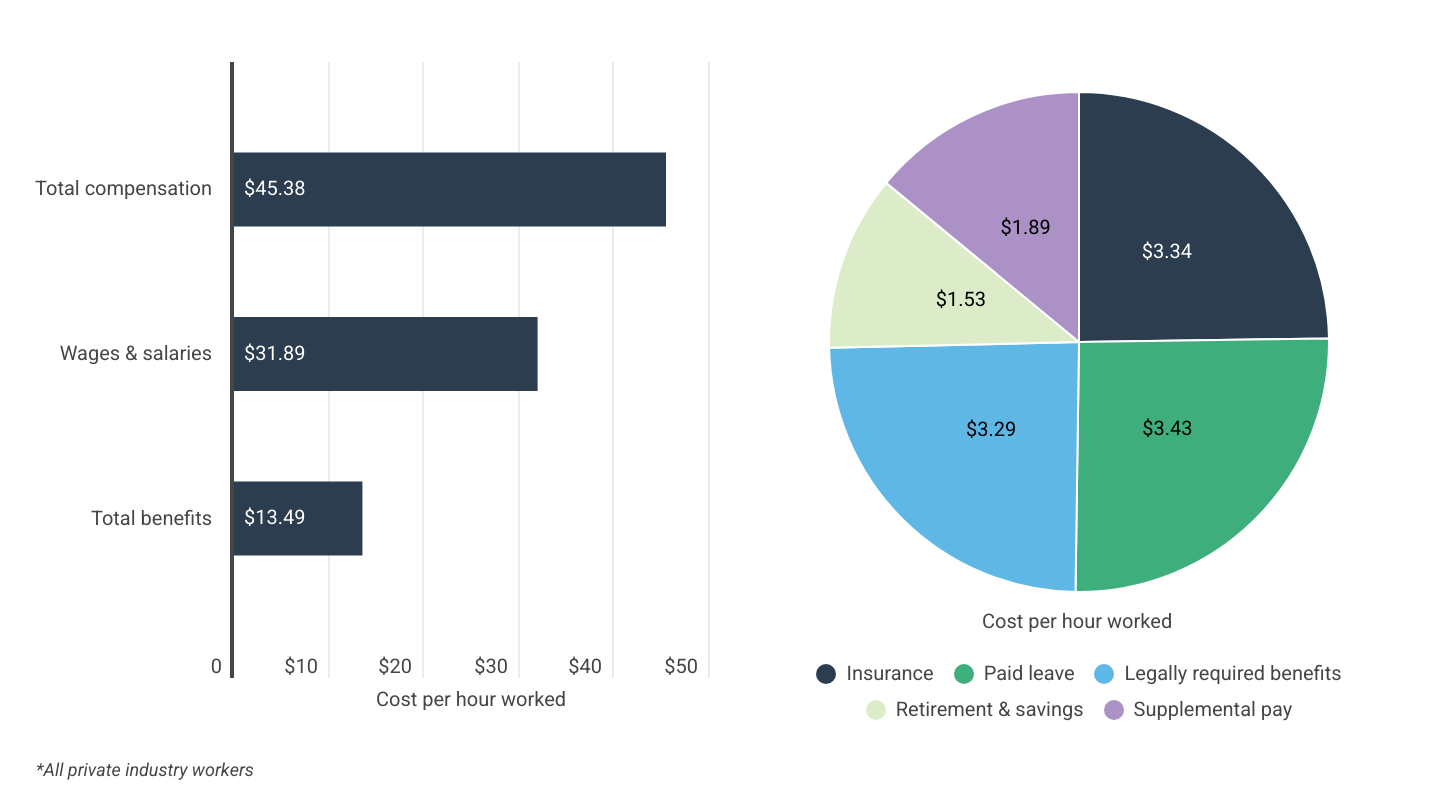
While wages and salaries make up the largest portion of compensation, employee benefits represent a significant share of labor costs for U.S. employers. Of the $45.38 total compensation cost per hour worked in 2025, $31.89 was attributed to wages and salaries, while the remaining $13.49 went toward employee benefits. This results in a labor burden rate of 42.3%, meaning that for every dollar spent on wages, employers spend an additional 42.3 cents on benefits.
Benefit costs span several categories. The largest component is paid leave at $3.43 per hour, which includes vacation, holiday, sick, and personal leave. Insurance benefits follow closely at $3.34 per hour, and primarily include health insurance but may also cover life and disability insurance.
Legally required benefits, amounting to $3.29 per hour, cover federal and state mandates such as Social Security, Medicare, unemployment insurance, and workers’ compensation. Supplemental pay, at $1.89 per hour, includes irregular compensation like overtime, shift differentials, and bonuses. Lastly, retirement and savings benefits total $1.53 per hour and include contributions to defined benefit pensions and defined contribution plans like 401(k)s.
Employee Compensation Costs by Business Size
Source: Construction Coverage analysis of BLS data | Image Credit: Construction Coverage
Business size is a primary driver of employee compensation costs, with smaller firms allocating a greater share of compensation to wages and larger firms investing more heavily in benefits. At businesses with fewer than 50 workers, wages account for approximately 75% of total compensation, while benefits make up the remaining 25%, yielding a labor burden rate of 33.6%. In contrast, firms with 500 or more employees spend only 65% on wages, with the remaining 35% allocated to benefits—raising the labor burden rate to 52.9%.
While legally required benefits such as Social Security and Medicare remain relatively consistent across business sizes (as a percentage of total compensation), larger employers tend to offer more generous retirement plans, insurance coverage, and supplemental pay. They also provide more comprehensive paid leave benefits. Notably, while wages make up a smaller share of total compensation at larger firms, the absolute dollar amount paid in wages is still significantly higher—illustrating that these firms tend to offer more competitive pay in addition to more generous benefits packages.
The Difference in Cost Between Union & Non-Union Workers
Source: Construction Coverage analysis of BLS data | Image Credit: Construction Coverage
The gap in compensation between unionized and non-unionized workers mirrors the disparities seen across different business sizes. Employers with unionized workforces—most common in the education, transportation, utilities, and construction sectors—face significantly higher labor costs, largely due to the structured nature of collectively bargained compensation packages. In 2025, the total cost of compensation for union workers averages $60.21 per hour, compared to $44.13 for non-union workers.
Union employers allocate nearly 40% of compensation to benefits, resulting in a labor burden rate of 64.2%. For non-union employers, benefits make up only 29% of compensation, with a labor burden rate of 40.1%. The largest cost differences lie in insurance and retirement benefits, where union firms contribute more than twice as much per hour as their non-union counterparts.
Despite benefits making up a larger share of total compensation, union firms also pay higher base wages, averaging $36.67 per hour versus $31.49 for non-union firms. This reflects the impact of negotiated labor agreements on both benefits and wages.
Employee Compensation Costs by Industry
Source: Construction Coverage analysis of BLS data | Image Credit: Construction Coverage
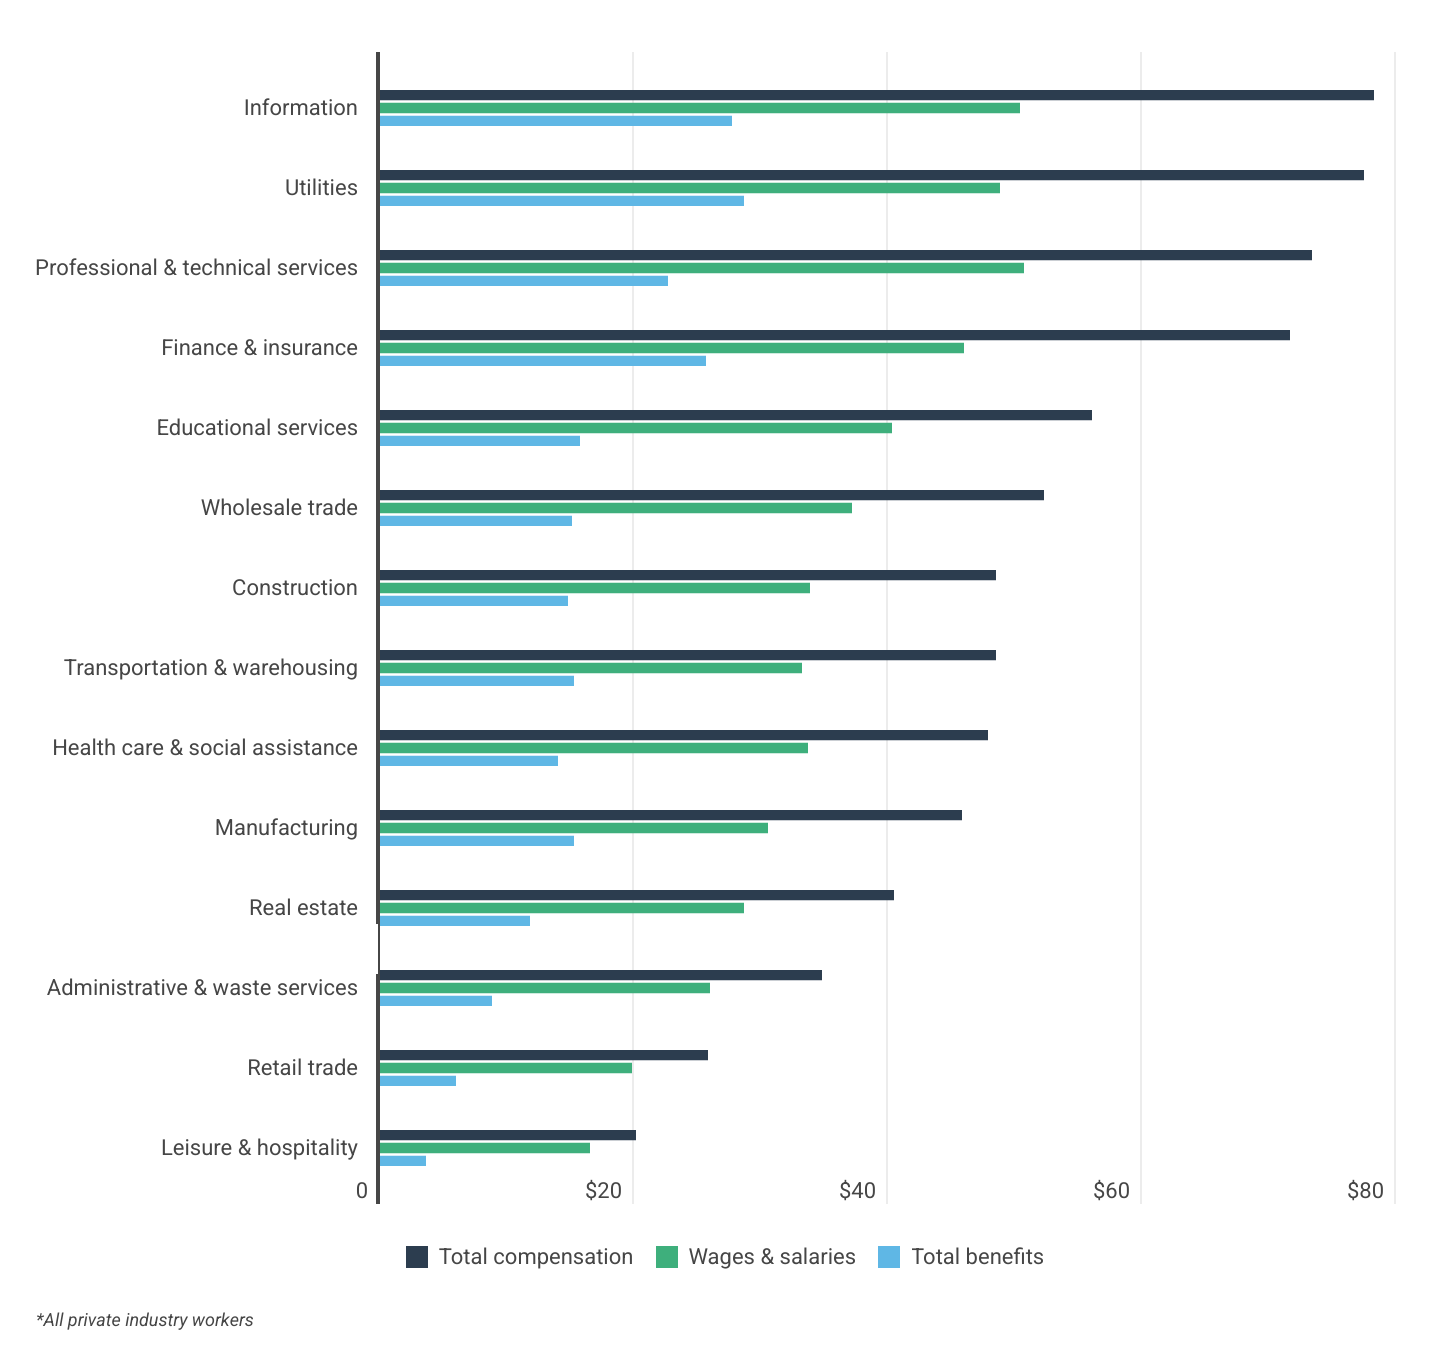
Industry-level differences in employee compensation costs are shaped by factors such as unionization, workforce skill levels, and the prevalence of part-time employment. There is a strong correlation between wages and benefits—but it’s not strictly proportional. Industries that offer higher wages often spend disproportionately more on benefits as well. For example, information, utilities, professional services, and finance all report total compensation costs above $70 per hour, with high labor burden rates. Utilities are heavily unionized, while information, professional services, and finance—despite lower unionization—attract skilled workers with both high salaries and robust benefits.
In contrast, sectors like retail trade and leisure and hospitality rank at the bottom in nearly every compensation category. Total compensation in leisure and hospitality averages just $20.13 per hour, with a labor burden rate of only 22.1%. These industries typically offer lower wages, fewer benefits, and employ a higher share of part-time and lower-skilled workers—many of whom aren’t eligible for full benefits. Industries such as construction and manufacturing fall in the middle range. With compensation averaging $48.58 and $45.85 per hour, respectively, these sectors provide moderate levels of both wages and benefits.
A notable trend is the higher share of legally required benefits—including unemployment insurance and workers’ compensation—in leisure and hospitality and construction. These industries tend to have higher employee turnover, greater injury risks, and a larger proportion of low-wage or seasonal workers, all of which drive up mandatory employer contributions relative to total compensation.
Employee Compensation Costs by Metro Area
Source: Construction Coverage analysis of BLS data | Image Credit: Construction Coverage
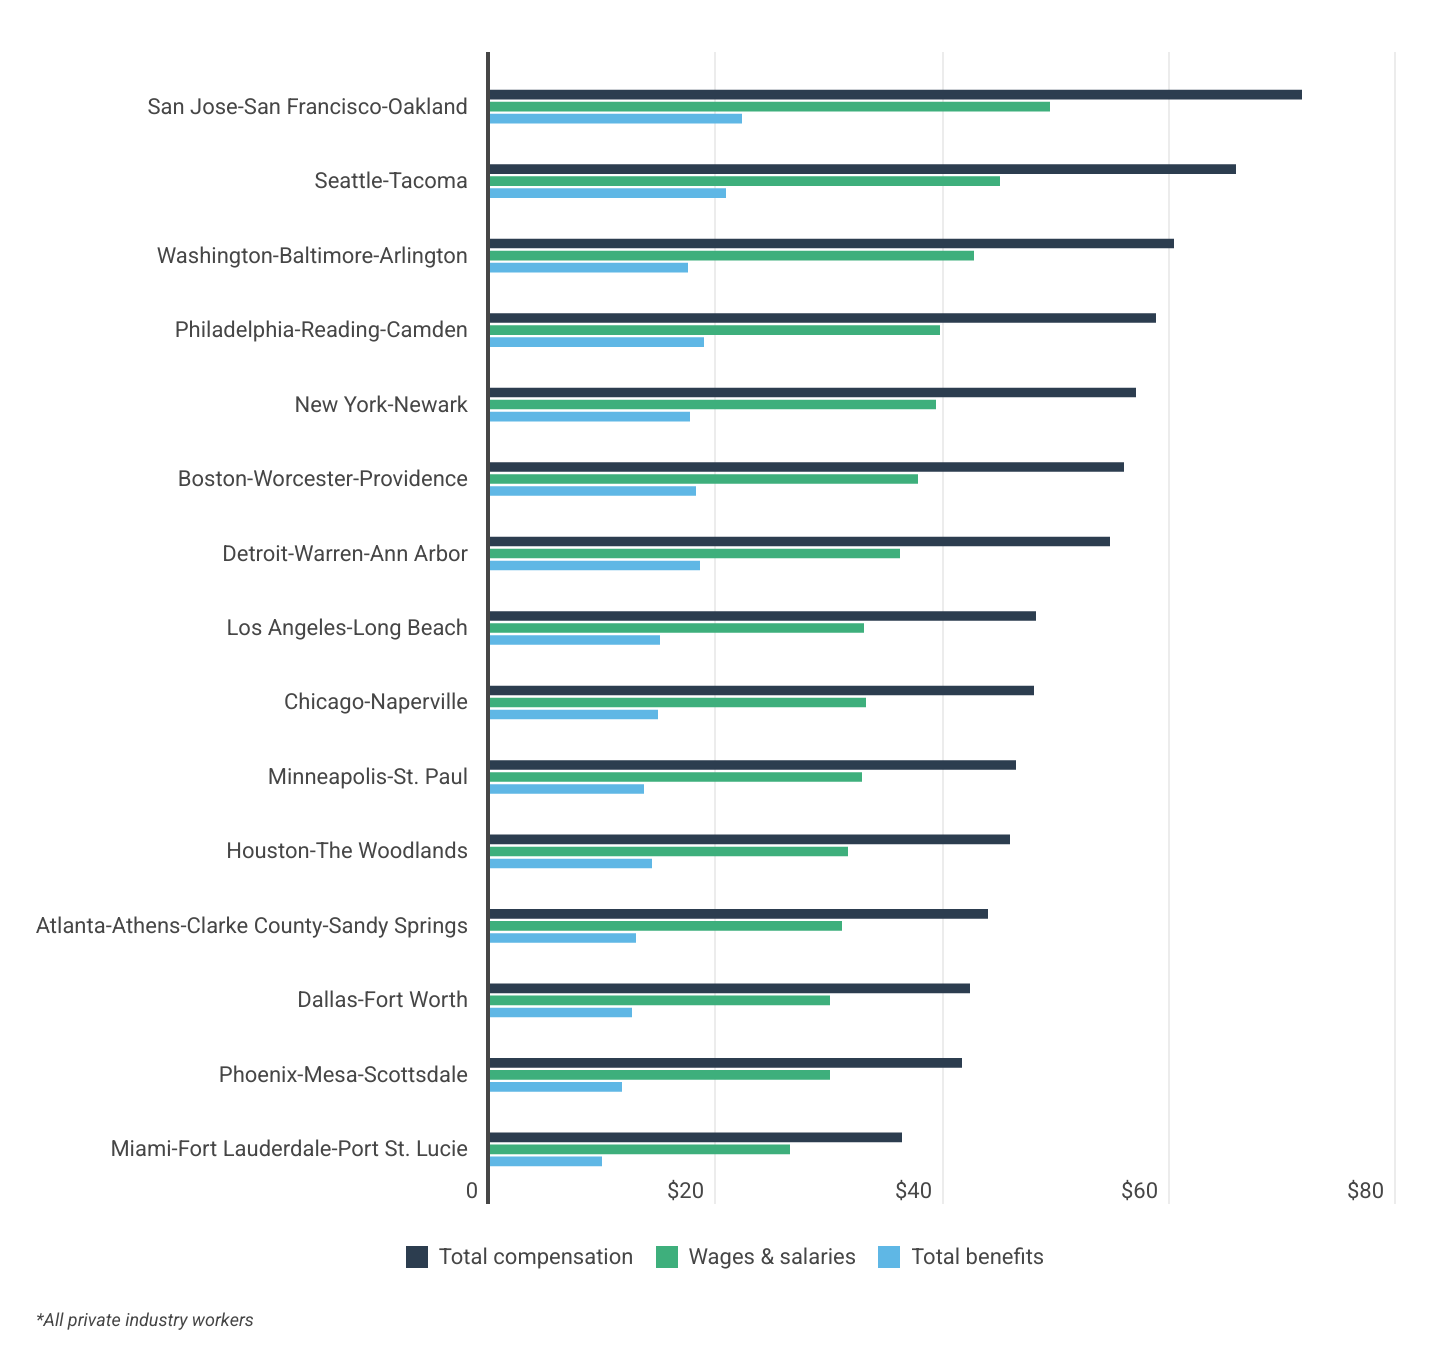
Compensation costs vary widely across U.S. metro areas due to differences in local economies, labor markets, and government policy. Key drivers include industry composition, the concentration of larger vs. smaller firms, unionization rates, and living costs. Differences in state and local labor laws also create disparities in legally required benefit costs.
At the top of the spectrum is the Bay Area, where San Jose–San Francisco–Oakland leads all metros with an average compensation cost of $71.63 per hour. This is driven by both the highest wage costs ($49.43) and benefit costs ($22.20) among major metros, and reflects the region’s high concentration of information and technology jobs. In contrast, Miami ($36.37) reports the lowest overall compensation cost. This is partly due to a greater share of lower-skilled service jobs—often in leisure, hospitality, and retail sectors—that tend to offer lower wages and limited optional benefits.
Unionization also plays a key role. Cities with higher union representation tend to show higher labor burden rates, with Detroit (51.3% labor burden rate) and Boston (48.2%) standing out. In contrast, metros with lower unionization, such as Miami and Phoenix, show some of the lowest labor burden rates, reflecting fewer benefits relative to wages.
As labor costs rise at their fastest pace in more than 15 years, many U.S. employers are paying closer attention to the full cost of compensation, including both wages and benefits. Although wages continue to make up the largest share of compensation, rapidly rising wages and insurance costs have driven overall labor costs higher across much of the private sector.
Patterns in compensation vary by industry, region, business size, and workforce composition, reflecting the influence of both economic and regulatory factors. In this context, tracking not only wage trends but also the broader makeup of employee compensation offers useful insights for budgeting and workforce planning.
For a full breakdown of compensation by industry, occupation, business size, union status, and metro area—including wages, benefits, and labor burden rates—see Beyond Wages: The Total Cost of Employing Workers in the U.S. on Construction Coverage.
Methodology

Photo Credit: Andrey Popov / Shutterstock
The data used in this analysis is from the U.S. Bureau of Labor Statistics’ Employer Costs for Employee Compensation (ECEC) program, which measures the average cost to employers for direct wages and a range of benefits.
Benefits captured in the ECEC data encompass several categories: paid leave (such as vacation, holiday, sick, and personal time), supplemental pay (including overtime, bonuses, and shift differentials), insurance benefits (such as health, life, and disability insurance), retirement and savings contributions (like pensions and 401(k) plans), and legally required benefits. The latter category includes contributions to Social Security, Medicare, federal and state unemployment insurance, and workers’ compensation.
The figures shown represent compensation costs for all private sector employees—both full-time and part-time. All data is from March 2025. To assess the relative cost of benefits in overall compensation, the labor burden rate was calculated by dividing total benefit costs by total wage and salary costs for each group.
For complete results, see Beyond Wages: The Total Cost of Employing Workers in the U.S. on Construction Coverage.


